
PERFORMANCE
Monongahela All Capital Value Fund (MCMVX) - Monthly Returns
| MCMVX Monthly Returns (net of all fees and expenses) | |||||||||||||||
|---|---|---|---|---|---|---|---|---|---|---|---|---|---|---|---|
| JAN | FEB | MAR | APR | MAY | JUN | JUL | AUG | SEP | OCT | NOV | DEC | YEAR | S&P 500 Index Plus Dividends | Russell 2000 Value Index Plus Dividends | |
| 2026 | 6.18% | 3.99% | -5.77% | 5.01% | 4.63% | 5.70% | |||||||||
| 2025 | 4.01% | -4.05% | -5.03% | -3.44% | 6.96% | 3.64% | 2.18% | 1.89% | 0.33% | 1.47% | 1.87% | 0.11% | 9.65% | 17.88% | 12.59% |
| 2024 | -0.99% | 4.89% | 6.36% | -4.28% | 1.92% | -0.87% | 5.77% | 1.31% | 2.64% | -2.81% | 7.08% | -5.64% | 15.39% | 25.02% | 8.05% |
| 2023 | 4.96% | -1.59% | -2.02% | 0.59% | -4.93% | 8.09% | 3.43% | -2.10% | -2.99% | -5.06% | 7.78% | 6.70% | 12.18% | 26.29% | 14.65% |
| 2022 | -2.32% | 0.32% | 0.59% | -4.81% | 0.95% | -7.83% | 7.71% | -3.30% | -9.84% | 9.69% | 6.44% | -3.63% | -7.73% | -18.11% | -14.48% |
| 2021 | 3.71% | 4.21% | 5.32% | 2.84% | 1.84% | -0.75% | 0.61% | 0.86% | -4.84% | 3.14% | -1.47% | 5.58% | 22.58% | 28.71% | 28.27% |
| 2020 | -3.08% | -7.60% | -16.07% | 12.38% | 6.02% | 1.49% | 3.68% | 2.63% | -0.07% | 0.14% | 13.35% | 3.23% | 13.25% | 18.40% | 4.63% |
| 2019 | 10.22% | 3.14% | -0.29% | 2.04% | -6.77% | 7.49% | -0.43% | -2.57% | 4.62% | 1.54% | 4.83% | 1.40% | 26.98% | 31.49% | 22.39% |
| 2018 | 3.55% | -4.59% | -0.50% | -1.44% | 0.95% | 1.16% | 4.30% | 2.96% | -0.74% | -7.87% | 4.09% | -9.13% | -8.10% | -4.38% | -12.86% |
| 2017 | 2.87% | 3.01% | 0.37% | 0.58% | -1.09% | 2.71% | 0.86% | -0.92% | 4.50% | 1.02% | 3.85% | 1.42% | 20.76% | 21.83% | 7.84% |
| 2016 | -4.24% | 2.02% | 7.07% | 0.70% | 0.00% | 0.79% | 4.86% | 1.90% | 0.65% | -1.53% | 6.39% | 1.40% | 21.29% | 11.96% | 31.74% |
| 2015 | -2.58% | 4.58% | -0.42% | -0.93% | 0.00% | -0.68% | -0.34% | -5.61% | -5.21% | 7.81% | 0.89% | -2.04% | -5.15% | 1.38% | -7.47% |
| 2014 | -4.82% | 3.09% | 1.73% | 0.54% | 0.62% | 1.94% | -1.99% | 3.36% | -2.22% | 1.05% | 1.39% | 1.32% | 5.84% | 13.69% | 4.22% |
| 2013 | N/A* | N/A* | N/A* | N/A* | N/A* | N/A* | 1.10% | -0.40% | 5.66% | 2.54% | 2.29% | 2.05% | N/A* | N/A* | N/A* |
GROSS EXPENSE RATIO 1.70%
NET EXPENSE RATIO 0.85%*
*Monongahela Capital Management has contractually agreed to waive its fee or reimburse expenses to limit total annual operating expenses to 0.85% through September 1, 2026.
Average Net Return as of June 30, 2026
| Net Return (as of Month-End) | Jun | Year to Date | 12 Month Return | 5-Year Annualized | 10-Year Annualized | Since Inception Annualized | Since Inception Aggregate |
|---|---|---|---|---|---|---|---|
| MCMVX | 5.70% | 20.83% | 30.59% | 10.39% | 13.46% | 11.86% | 329.29% |
| S&P 500 Index plus dividends | -0.95% | 10.21% | 22.32% | 13.41% | 15.51% | 14.56% | 485.19% |
| Russell 2000 Value Index plus dividends | 3.97% | 22.99% | 43.01% | 8.23% | 10.89% | 9.74% | 234.80% |
Average Net Return as of June 30, 2026
| Net Return (as of Quarter-End) | Sep 2025 | Dec 2025 | Mar 2026 | Jun 2026 | 1-Year Return | 5-Year Annualized | 10-Year Annualized | Since Inception Annualized |
|---|---|---|---|---|---|---|---|---|
| MCMVX | 4.45% | 3.48% | 4.04% | 16.14% | 30.59% | 10.39% | 13.46% | 11.86% |
| S&P 500 Index plus dividends | 8.12% | 2.66% | -4.33% | 15.20% | 22.32% | 13.41% | 15.51% | 14.56% |
| Russell 2000 Value Index Plus Dividends | 12.60% | 3.26% | 4.96% | 17.19% | 43.01% | 8.23% | 10.89% | 9.74% |
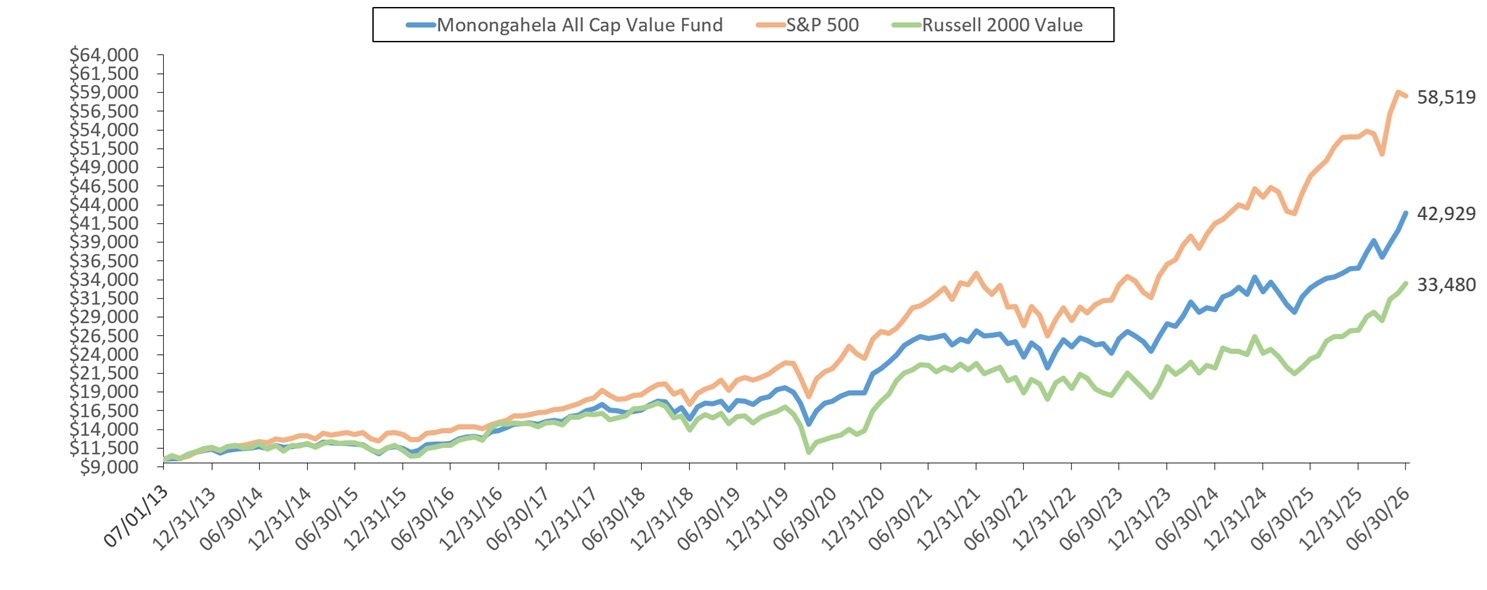
HYPOTHETICAL GROWTH OF $10,000 (Month-End)
As of June 30, 2026
The quoted performance represents past performance, which does not guarantee future results. Current performance may be lower or higher. The investment return and principal value of an investment will fluctuate so that shares, when redeemed, may be worth more or less than their original cost.
Performance detailed above reflects the actual performance of the Fund net of all fees and expenses.
All performance shown is total return assuming automatic reinvestment of the Fund’s distributions. Returns reflect fee waivers and/or expense reimbursements in effect during those periods, and would have been lower in their absence.
The performance shown does not reflect a 1% redemption fee applied to shares redeemed within 60 days of purchase.